
The retail sales growth of natural food and beverage products is much higher than growth of the overall food and beverage market, according the 2019 State of the Natural Industry report from SPINS.
The total food and beverage retail market (now a $448.2 billion market) is growing 1.7% year over year, according to SPINS data. In comparison, the market for natural food and beverage products is growing at 5.0%, although 2019 growth is slightly lower than previous years. “Natural products are 10.5% of the dollar volume, yet responsible for 29.3% of dollar growth across the total marketplace, in part due to a more premium price point,” states the report.
While natural products continue to grow at 4% to 5% in natural and specialty retail outlets, conventional retail stores are seeing increased sales of natural products as well. In the Conventional Multi Outlet Channel for foods and beverages, natural products were 9.1% of total dollar volume (up from 7.7% in 2016) but were responsible for 27.4% of growth for the year ending May 2019.
Growth was even higher in the Convenience Channel, with 11.0% unit growth and 12.6% dollar growth to $2.7 billion. While natural products are still only 4.6% of dollar volume, they contributed 15.9% of dollar growth for food and beverage categories in this channel for the year ending May 2019. Natural performance beverages, enhanced waters, puffed snacks, and kombucha are a few key subcategories driving growth.
Adoption of natural products is highest on the east and west coasts, with California on the leading edge of natural-product adoption. The following table shows the geographical distribution of sales.
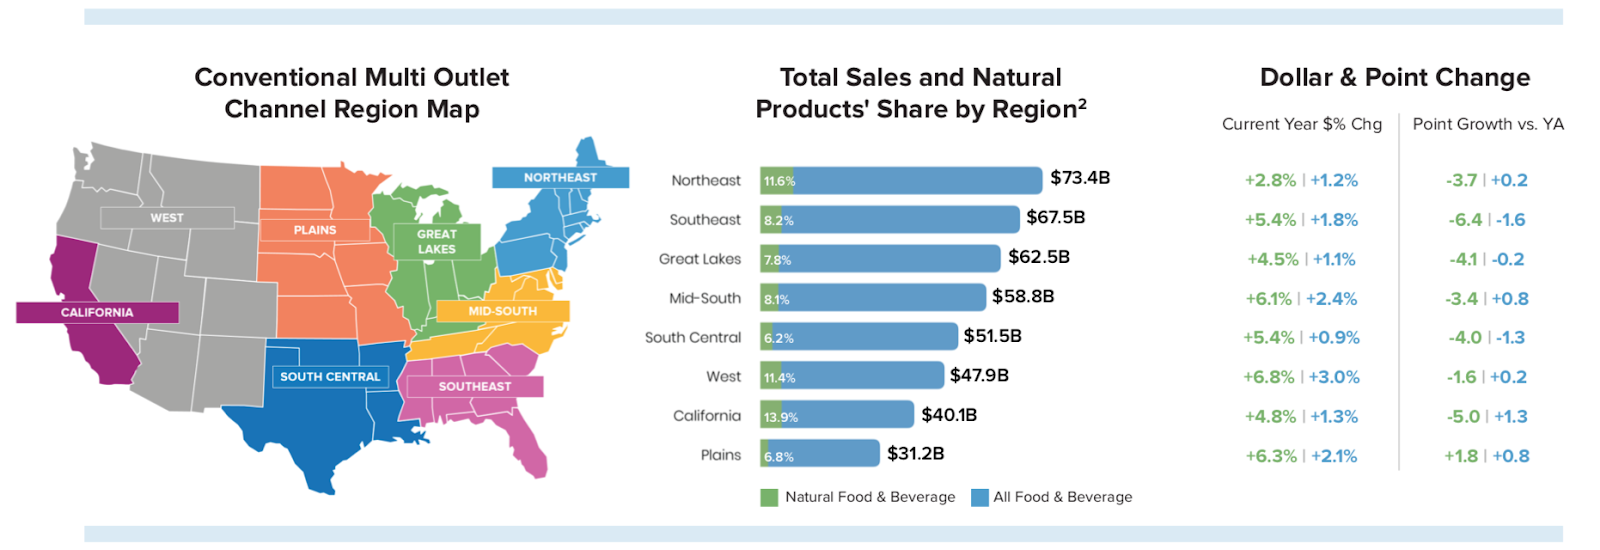
Figure 1 Source: 2019 State of the Natural Industry report from SPINS
The report also looked at subsets of the natural market.
Organic
Organic products had a sales volume of $13.4 billion. While certified-organic items make up only 3.0% of total food and beverage sales, the 2.8% growth rate was higher than that of the total food and beverage market. Growth in organic sales was highest in the Conventional Multi Outlet Channel, with 3.2% growth over the previous year, for $10.0 billion in sales.
The three categories with the highest organic sales volume were produce, milk, and refrigerated juices & functional beverages. Looking inside categories, the ones with the highest percentage of organic sales were refrigerated tofu (57.8%), shelf-stable plant-based milk (23.9%), shelf-stable tea (15.4%), and refrigerated juices & functional beverages (13.4%).
Vegan
Food and beverage products labeled as vegan are a $7.1 billion market, growing at a rate of 10.1%. The Conventional Multi Outlet Channel had $5.5 billion of that sales volume, with a 10.8% growth rate. The fastest-growing categories for vegan food included refrigerated plant-based alternatives to dairy milk and meat. However, the fastest-growing vegan category was chips, pretzels, & snacks, up 12.7% to $661.5 million in cross-channel grocery.
Paleo/Grain-Free
Paleo-positioned products grew by 45.3% to $536.7 million, and grain-free products increased 76.0% to $271.5 million. The fastest-growing category for Paleo products was baking mixes & ingredients (235.0% growth to $55.4 million). Products with explicit grain-free labeling grew by 158.5% to $28.5 million.
Paleo/grain-free products also grew in the the chips, pretzels, & snacks category. Paleo-positioned products in this category were up 163.5% to $41.1 million, while grain-free snacks were up 258.3% to $29.7 million. Paleo/grain-free growth was much faster in the Conventional Multi Outlet Channel than other channels. SPINS believes this growth proves the trend’s power and mainstream opportunity.


