

By Jason Chester, Director of Global Channel Programs, InfinityQS® International, Inc.
Data are the essential fuel to any food manufacturer’s quality assurance program. Data can inform you when there’s a quality issue, a machine needs maintenance, or a process requires adjustment, among other possible events across the production line. During times of major upheaval—as we’ve seen with COVID-driven disruption in the past year—data can also guide you in how to pivot operations to maintain productivity, quality, and safety.
Surfacing these insights for timely response can be a challenge, however, given the sheer volume of data being generated on the modern plant floor. Whereas manufacturers once had to rely on sparse hand-written measurements by operators during quality checks, Programmable Logic Controllers (PLCs), Supervisory Control and Data Acquisition (SCADA) systems, and Industrial Internet of Things (IIoT) devices can now automatically collect thousands—even millions—of data points every minute, around the clock. Extrapolate that across every line, process, and site, and it can easily feel like you’re drowning in data.
To overcome the data deluge, food manufacturers must adopt new means of summarizing and visualizing data, which can provide heightened understanding into what’s happening on the plant floor, at every plant, and in real time. With such clarity, you can accelerate your time to quality insight and therefore time to action—achieving the level of agility that so many organizations desire for business resilience in a post-pandemic world.
Quality intelligence begins in the cloud
Obtaining quality insights, or “quality intelligence,” first requires consistent and centralized data. When thinking about a solution that can aggregate the vast amounts of data from your various PLCs, SCADA systems, IIoT devices, and other auxiliary data collection tools, those familiar with the concept of digital transformation will naturally point to the cloud.
The cloud provides a unified repository that supports the centralization and standardization of data collection. With real-time and historical data stored in this repository, you can readily compare processes within a single plant or between sites, as well as grant anywhere, anytime access to quality intelligence for employees at all levels of the business. This makes cloud an ideal solution for manufacturers who have recently struggled to connect plant-level operators with quality and plant managers working remotely at home during COVID-19.
Everyone works with the same information and can thereby collaborate to monitor process performance and uphold food quality standards—no matter where they’re located. With social distancing measures expected to continue for the foreseeable future, cloud adoption is set to only gain more momentum in the months ahead.

Seeing what makes the grade
Once they have access to data in the cloud, how can plant and remote teams effectively translate what’s been collected into quality intelligence? One innovative way is through “stream grading,” where quality intelligence software automatically applies statistical process control (SPC)—an industry-standard method for measuring and controlling the manufacturing process—to analyze process performance and assign a letter-number combination to data streams coming from your various products, lines, and sites.
A letter grade (A, B, or C) represents the potential yield of a stream, while the number (1, 2, or 3) represents its actual yield performance based on your defined specification limits. A letter A grade indicates a stream will likely fall within specification limits. Conversely, a C grade indicates the stream will likely stray from the limits. As for the numbers, a value of 1 shows a process is well centered within the specification limits, 2 shows it may be off center, and 3 signals significant deviation.
Together, an A1 grade is a high-yield stream that’s meeting its full potential, while a C3 grade is a low-yield stream that’s performing poorly. The greatest opportunities for process improvement are the A3 grades, as these streams have the potential to perform well but are currently experiencing deviation. It’s a good idea to prioritize corrective action on these lines, as they can provide the greatest and fastest returns in process improvement.
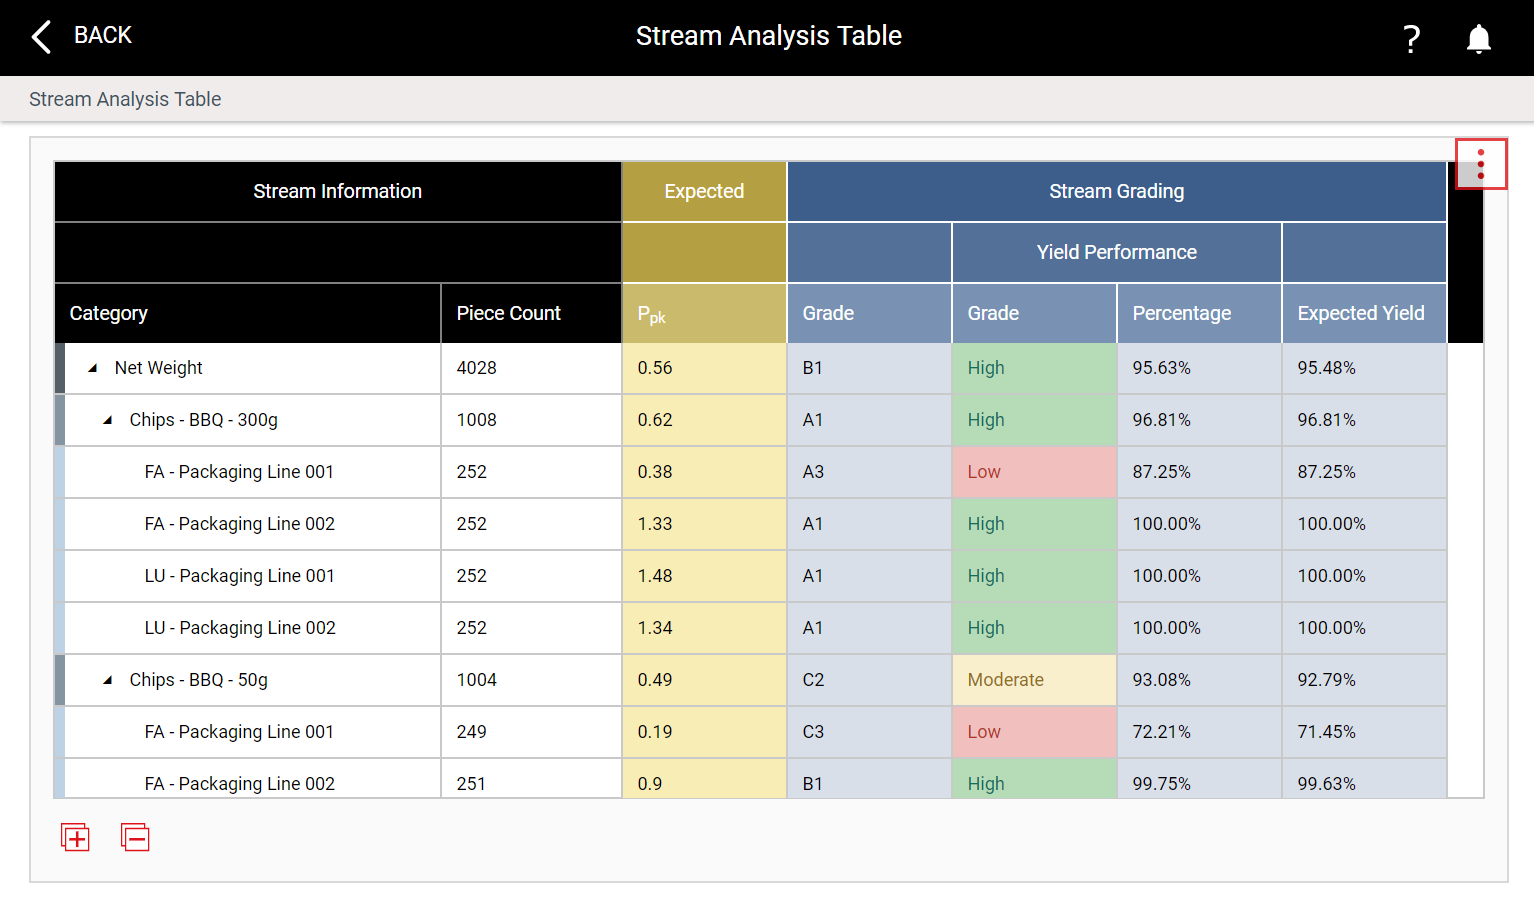
When plant operators and remote managers have a convenient way to review the grades of multiple streams, such as in a grading matrix on a dashboard, it’s easy to quickly run comparative analyses and identify how to improve processes, as well as where and when to expend efforts and resources.
A picture worth thousands of streams
For those who are more visually inclined, charts can be beneficial, as they can illustrate patterns and other observations that would otherwise be buried in spreadsheets of data. One type of chart that stands out is the bubble chart.
In just a single graph, bubble charts can distill thousands of large datasets into an intuitive—and multidimensional—visual displaying the percentage of on-time quality checks, the performance yield for a process or product, or the number of quality issues. These metrics are plotted on an X-Y axis, with colored bubbles representing different plants. Varying bubble sizes on each chart illustrate the amount of data represented in a bubble.

At a glance, your quality team members can determine if quality checks are being performed on time, if yields are going up or down, how one process is performing compared to another, and which areas are showing signs of improvement or degradation. Moreover, instead of just a static snapshot, animated bubble charts can show how these metrics are shifting over time, making it possible to identify ongoing trends.
Bubble charts can also be used in tandem with grading, where you use the graphs to visually identify areas in need of improvement or corrective action. Grading then enables you to drill further down for a deeper understanding of quality and process performance, and thereafter prioritize opportunities according to what will deliver the most transformative benefits for your manufacturing operations and business.
Looking ahead, food manufacturers who can not only rise above the data deluge, but also harness the vast amounts of data being generated on their plant floors, will stand a cut above the rest—ready and able to act with quality intelligence from anywhere, at any time. Investments now in cloud, data analytics, and visualization tools can therefore be seen as investments necessary for the future. These are proactive steps toward digitally enabled business resilience and data-driven agility to navigate times of both peace and uncertainty.
 Jason Chester is responsible for the implementation, management, and success of InfinityQS’ Global Channel Partner Program. With over 25 years of experience in the enterprise IT industry, Jason’s current area of interest is the impact of next-generation technologies on manufacturing—a topic he frequently writes about in the trade press.


