
Key takeaways:
- The USDA’s July WASDE cut the US sugar stocks-to-use ratio from an estimated 18.9% in 2024-25 to a forecast 13.4% for 2025-26, below the agency’s own 13.5%-15.5% bullish threshold. The USDA calculated that number from deliveries and consumption data already on the books for the current crop year.
- US beet acreage fell to 1.033 million acres in 2026, the lowest planted area in more than 45 years, with drought and thin grower margins pulling down plantings across multiple states in the same season.
- Sugar, cocoa, and coffee are among the commodities most exposed to a possible Super El Nino. That’s a distinct, still-probabilistic risk layered on top of the confirmed domestic tightening.
What the July WASDE confirmed about US sugar stocks
On July 10, 2026, the USDA’s World Agricultural Supply and Demand Estimates report cut the projected 2025-26 US sugar stocks-to-use ratio to 13.4%, down from an estimated 18.9% the prior crop year. That falls below the range the USDA sees as the marker of a bullish, tightly supplied market: 13.5% to 15.5%.
There are two drivers behind this:
- Food-use delivery estimates for the year rose 2.2%, from an initial 12,176,000 tons to 12,441,000 tons by July.
- And beet sugar deliveries have come in above the five-year average every month since January.
Why beet acreage collapsed to a 45-year low
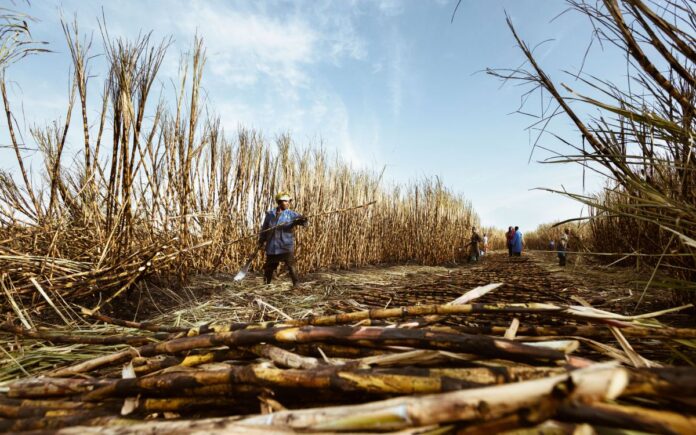
The supply side of that ratio has its own story. Planted beet acreage for 2026 came in at 1.033 million acres, down 4.3% from 2025 and the lowest in more than 45 years. Harvested area, at 1.011 million acres, is the third-lowest since 1980-81. Beet sugar production for 2026-27 is now forecast at 4.821 million short tons, the lowest since 2019-20.
This outcome traces back to drought across Colorado and Nebraska’s Western Sugar Cooperative territory, where snowpack-dependent irrigation came up short, plus thin returns on beets elsewhere that gave growers little reason to plant more even where water wasn’t the constraint. As Colorado farmer Paul Schlagel said, without the price setback, “we have the opportunity to expand acres.” The economics and the weather leaned the same direction in the same year, which is why the acreage number moved as far as it did.
How a Super El Nino could impact the numbers
JPMorgan estimates that a Super El Nino, on its own, would add roughly 0.7 percentage points to global food inflation at its peak, rising to 1.3 to 1.5 points if it lands alongside an energy-price shock. That’s an economy-wide food-basket number, but sugar is one of the commodities most impacted by adverse weather patterns, alongside cocoa, palm oil, and coffee.
The NOAA update put the odds of an extremely strong El Nino at 81% by year-end, with a 97% chance conditions persist into 2027. JPMorgan puts the biggest price impact four to eight months after onset, meaning the window that matters most is roughly the first half of 2027, not this quarter.
So the domestic story and the global story are running on different clocks. The stocks-to-use ratio and the acreage number are already in the data. The El Nino exposure is a dated, named, but still probabilistic call on where prices go next year.
Why AI demand forecasting doesn’t solve this problem
Demand forecasting tools excel at reading a shift in consumption patterns faster than a quarterly review would catch it, and holding more variables in view at once than a single planner can. FMI’s Doug Baker argues that the real bottleneck in most supply chains isn’t model accuracy at all. It’s whether the business has defined its own priorities and constraints clearly enough for a model’s output to translate into a decision multiple functions will act on.
But that doesn’t impact the input side of this specific problem. A forecasting model trained on historical demand and price data doesn’t have a mechanism for pricing in a NOAA probability update or a grower’s planting decision before either shows up in the numbers it was trained on. A Super El Nino is not the kind of event a model built on historical patterns is designed to see coming. The acreage and stocks data can be fed into a forecast the moment they’re published. The next NOAA update can’t be predicted by one.
Which contracts to lock now, and which to leave floating
The domestic tightening is already confirmed. The 13.4% stocks-to-use ratio and the 1.033 million planted acres are both settled figures from the July WASDE and the June acreage report. That argues for locking near-dated physical coverage now, while the ratio has no confirmed catalyst to loosen it.
The El Nino exposure is an 81% probability with a payout window months out. That’s significant and worth planning around. But locking multi-quarter, fixed-price volume against it today means paying a premium for a scenario that hasn’t happened yet.
Use forecasting tools to size the range of outcomes, then decide how much to carry uncovered. A model can show what happens to input costs at 13.4% stocks-to-use versus 10%, which is useful for deciding how much volume to lock versus leave open. Predicting which scenario really plays out is a separate problem, one the data feeding these models can’t solve yet.
The stocks-to-use number is confirmed. The acreage number is confirmed. The El Nino number is a probability with solid odds attached to it. Split next year’s sugar contracts to match: lock against what’s settled, leave room against what’s still a bet, and price the two differently.