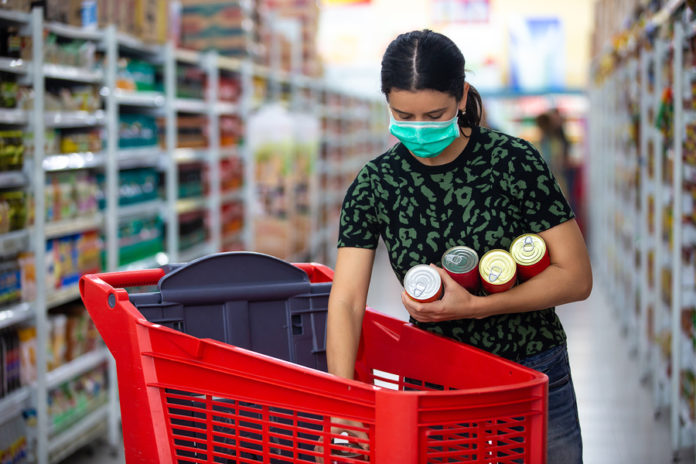
COVID-19 has changed consumer buying patterns. Tracking verified point-of-sale and e-commerce data, market research company IRI has published a series of reports over recent weeks showing the effects of COVID-19 on consumers and the CPG and retail industries.
To bring the most up-to-date information to the industry, IRI announced its new IRI CPG Demand Index on April 27. The Index measures weekly changes in consumer purchases, by dollar sales, compared to the same period last year.
“The COVID-19 pandemic has completely changed consumer behavior and spending, creating significant challenges for CPG companies seeking to appropriately allocate their resources and effectively meet consumer demand,” said Dr. Krishnakumar (KK) S. Davey, president of Strategic Analytics for IRI in the press release announcing the new Index.
Highlights of recent IRI reports
Many consumers expect their lives to be different after the pandemic, according to COVID-19 Impact on CPG Retail: Anticipating Life After COVID-19, published April 17. Other points from the report include:
- New spending habits are likely to continue, including more use of e-commerce and increased purchases of private label products, value brands, and larger or smaller package sizes. IRI expects most food spending to remain for at-home eating up to a year after COVID-19 declines.
- Price increases, purchase limits, and e-commerce delays frustrate consumers, even as they are becoming slightly less anxious about COVID-19.
- Most consumers continue to make fewer shopping trips but purchase more when they shop. Large-format retail sales are slightly up but remain below peak panic buying. Fresh department sales are up and baking categories are in demand.
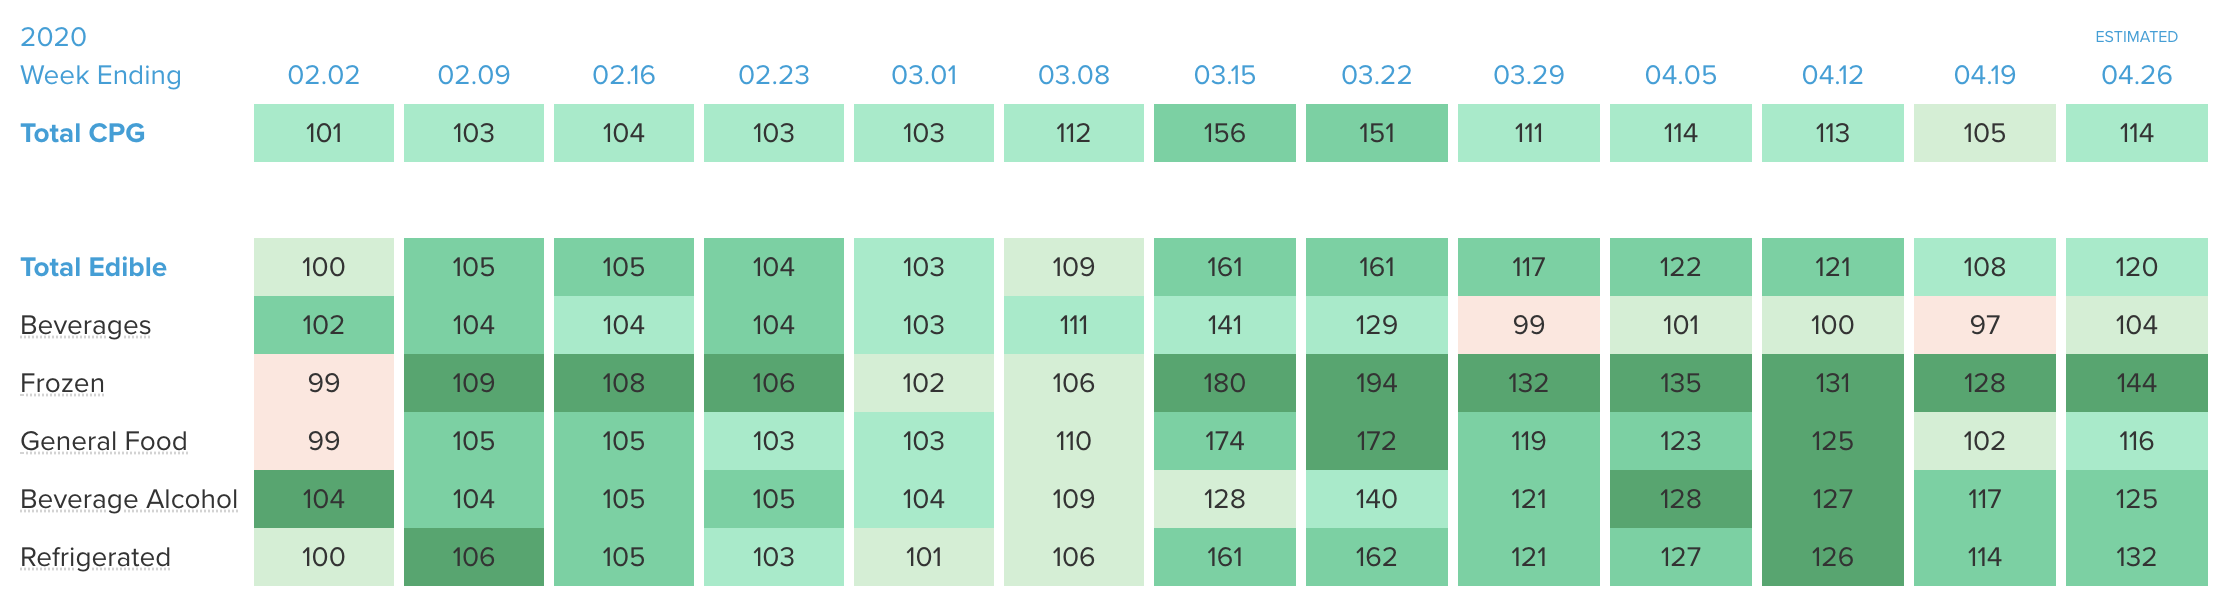
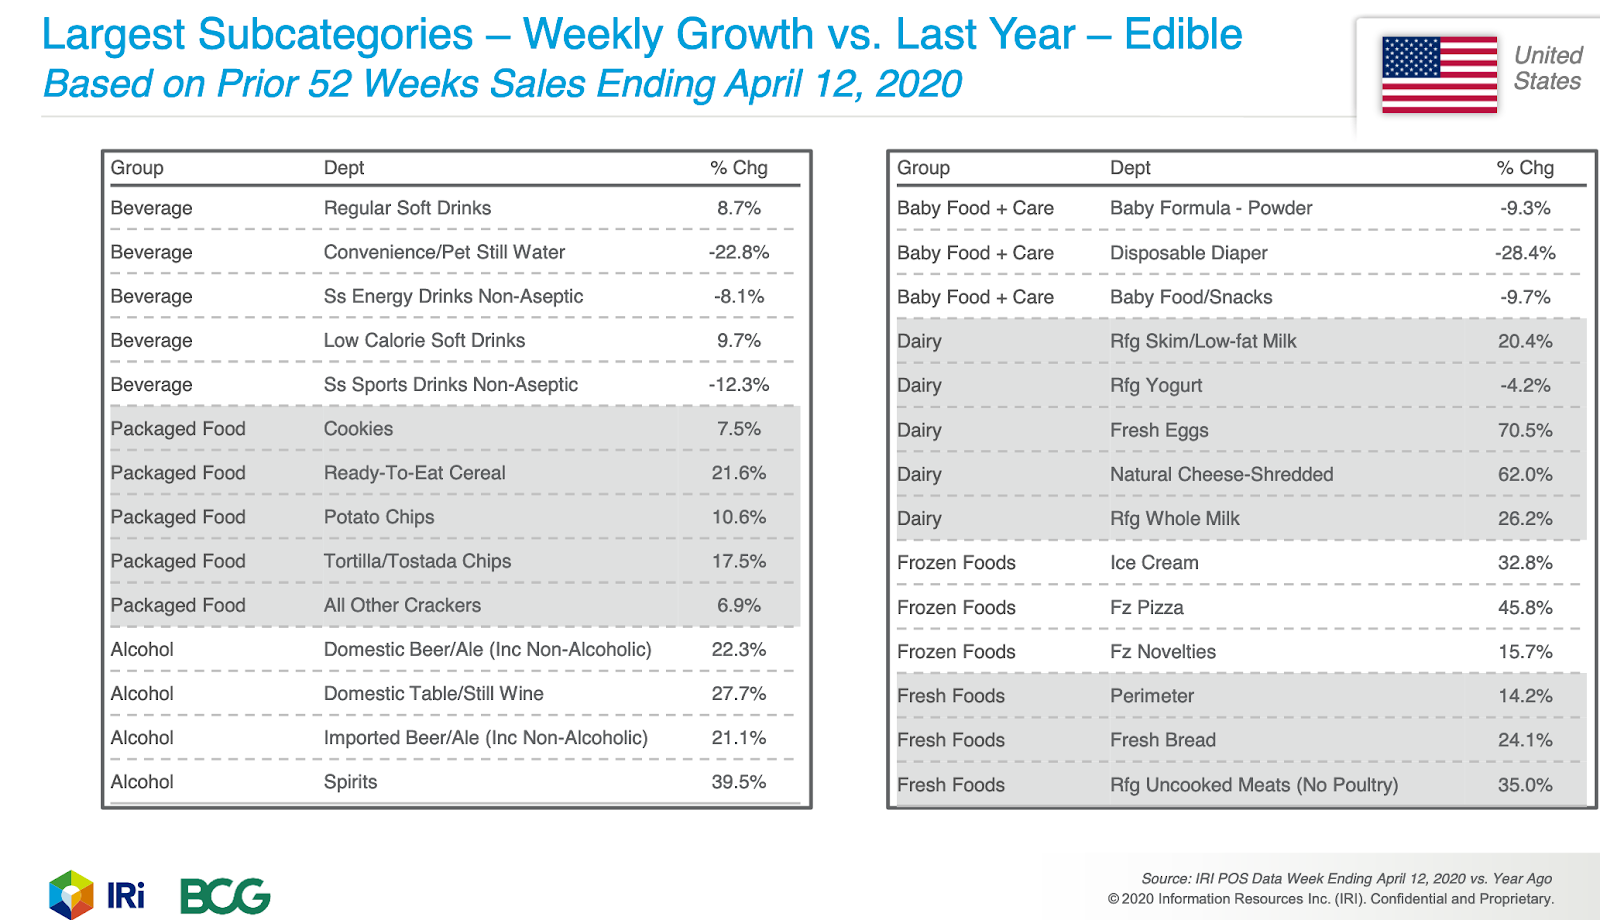
The most recent COVID-19 Impact: Consumer Spending Tracker For Measured Channels, published April 23, found sales for the week ended April 12 were down from the mid-March panic shopping peak but remained up 13% compared to the same period last year. The following chart shows a breakdown of food categories with weekly growth compared to last year.
Insights for the week ended April 12 include:
- Frozen food had the highest demand, up 31% compared to the same year period last year.
- Alcohol demand in measured channels was up 27% compared to the same year period last year
- The grocery channel remained the destination winner for food, up 33%, and for nonedibles, up 16%.
- Total shopping trips were down 4%, slowing significantly from their peak in mid-March. Although consumption was up, edible trips remained about the same as a year ago
- Fewer trips meant larger baskets when consumers did shop. The size of total store baskets was up 22%, with edible basket items up 27%
The shape of the CPG demand curve continues to evolve and industry needs to react quickly as the country moves toward reopening the economy, according to The Changing Shape of the CPG Demand Curve, published April 24. The main points from this report:
- It’s important for brands and retailers to communicate, inform, and support shoppers during COVID-19. To retain new buyers, marketers need to act quickly with targeted messages, in-store marketing, and promotional activities.
- E-commerce continues to grow, despite consumer frustration with fees.
- Overall CPG dollar demand is flattening, but a much larger than normal share of food spending remains with the grocery channel.
Although many sources are asking how these changes will play out after the pandemic, there’s little basis for making long-term predictions. Food manufacturers will have to remain informed and agile enough to adapt to changing conditions.