

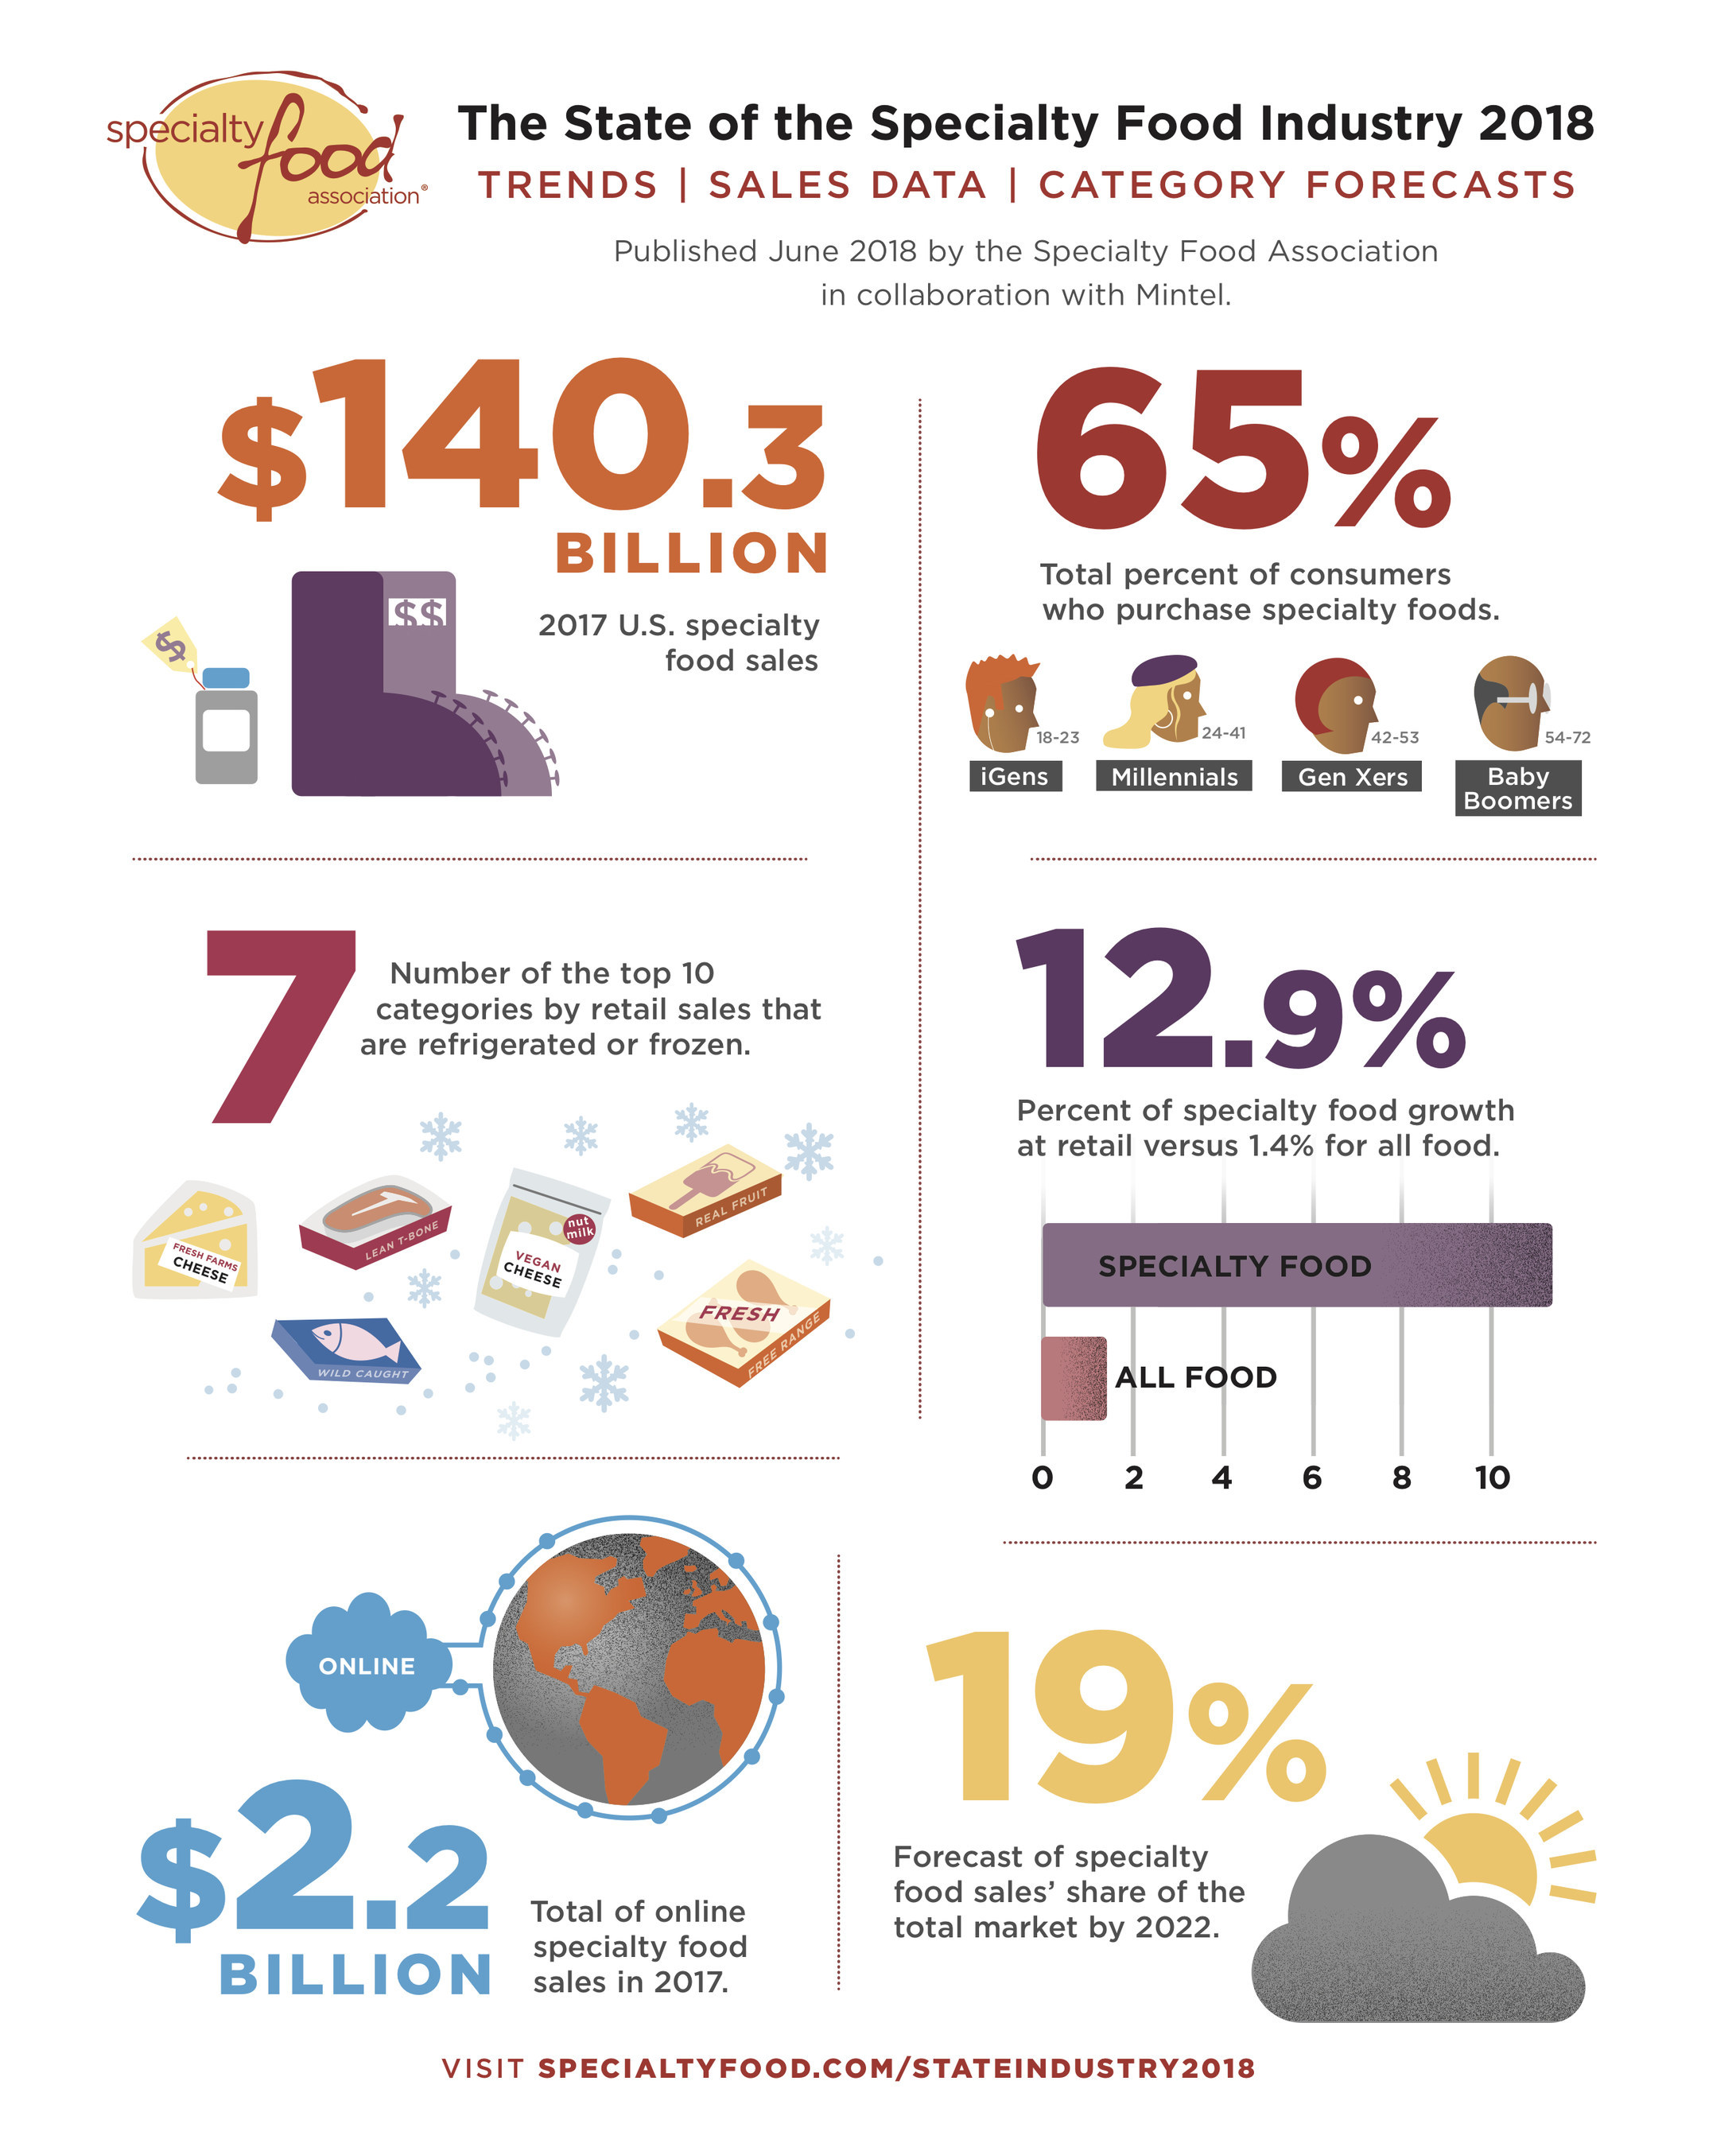
Between 2015 and 2017, specialty food saw sales growth of 12.9%, compared to 1.4% for all food at retail, according to the State of the Specialty Food Industry 2018 report from the Specialty Food Association. That brought the total market share for specialty foods up to 15.8% and the total value to $140.3 billion. The Specialty Food Association credits increasing interest, product innovation, and wider availability of specialty foods for the increase.
Here are some key findings from the report.
Most consumers, especially younger ones, purchase specialty foods
Two-thirds (65%) of consumers purchase specialty foods, and the likelihood that they will do so is inversely related to age.
Share of consumers buying specialty foods by generation (2018)
- iGens (age 18-23): 79%
- Millennials (age 24-41): 67%
- Gen Xers (age 42-53): 65%
- Baby Boomers (age 54-72): 60%
Specialty foods are in demand across categories
Convenience, health, beverages — the trends we see across the industry are fueling growth in specialty foods as well.
Top specialty foods products by retail sales
- Cheese and plant-based cheese
- Frozen or refrigerated meat, poultry, and seafood
- Chips, pretzels, and snacks
- Non-RTD coffee and hot cocoa
- Bread and baked goods
Specialty foods categories with the highest dollar growth
- Water
- Rice cakes
- Refrigerated RTD tea and coffee
- Jerky and meat snacks
- Shelf-stable creams and creamers
Specialty foods sales are growing across channels
While mainstream channels make up 82% of total retail sales of specialty food, alternative channels are growing. More than 20% of specialty food sales are via foodservice.
Top sales of specialty food by market segment (% change 2015 to 2017)
- Brick-and-mortar retail channels: +10.7%
- Foodservice: +12.8%
- Online: +20.9%
For more information, download the free report.


